Who Bears the Burden? Heterogeneous Racial Approval Differentials in U.S. Mortgage Lending: Causal Forest DML on 42 Million HMDA Applications
Not whether an average penalty exists, but who bears it, and through which underwriting channel.
The discovery in one figure
Swipe to see the whole figure
The paper in five minutes
Knowing the average approval gap is not enough, because averages hide who actually pays. Using methods from modern causal inference, the same family behind clinical-trial analysis, this paper estimates the approval penalty for each applicant profile across 42 million mortgage applications. The distribution is wide: nine in ten Black applicants face some estimated penalty, and the decisive factor is not the applicant but the process. Applications handled by human underwriters carry more than double the penalty of those decided by automated systems, which points the fairness question at something a regulator can act on.
The research question
Average disparity estimates hide distribution: which applicant profiles carry the largest conditional racial approval penalty, and is the mechanism applicant- or lender-controlled?
How it works
Partially linear double machine learning with LightGBM nuisances and 5-fold cross-fitting; causal-forest CATE estimation with SHAP attribution; placebo, Oster, and Cinelli-Hazlett sensitivity analyses; within lender-year comparisons.
- 01Engineer at scale42M HMDA applications → 2M / 1.5M estimation samples
- 02Isolate the differentialdouble machine learning, LightGBM nuisances, 5-fold cross-fitting
- 03Map who bears itcausal forest estimates the penalty per applicant profile
- 04Find the mechanismmanual vs automated underwriting · same lender, same year
- 05Attack the resultplacebo shuffles · Oster bounds · Cinelli-Hazlett sensitivity
Experimental results
Pooled conditional differential −9.39 pp with wide heterogeneity (CATE SD 8.47 pp); 90.7% of Black applicants face a negative estimated effect. The channel is decisive: manual underwriting −14.79 pp vs automated −6.17 pp, and 7.13 pp persists within the same lender and year.
−14.79 pp−9.39 pp−7.13 pp−6.17 ppBar length = size of the estimated Black-White differential (all negative). The channel, not the applicant, is decisive.
- −9.39 ppconditional differential (pooled DML)
- −14.79 vs −6.17manual vs automated underwriting (pp)
- 90.7%of Black applicants with a negative effect
Stated honestlyThe level is treated as an upper bound (no credit scores in HMDA); the channel contrast is the robust object.
Figures from the paper
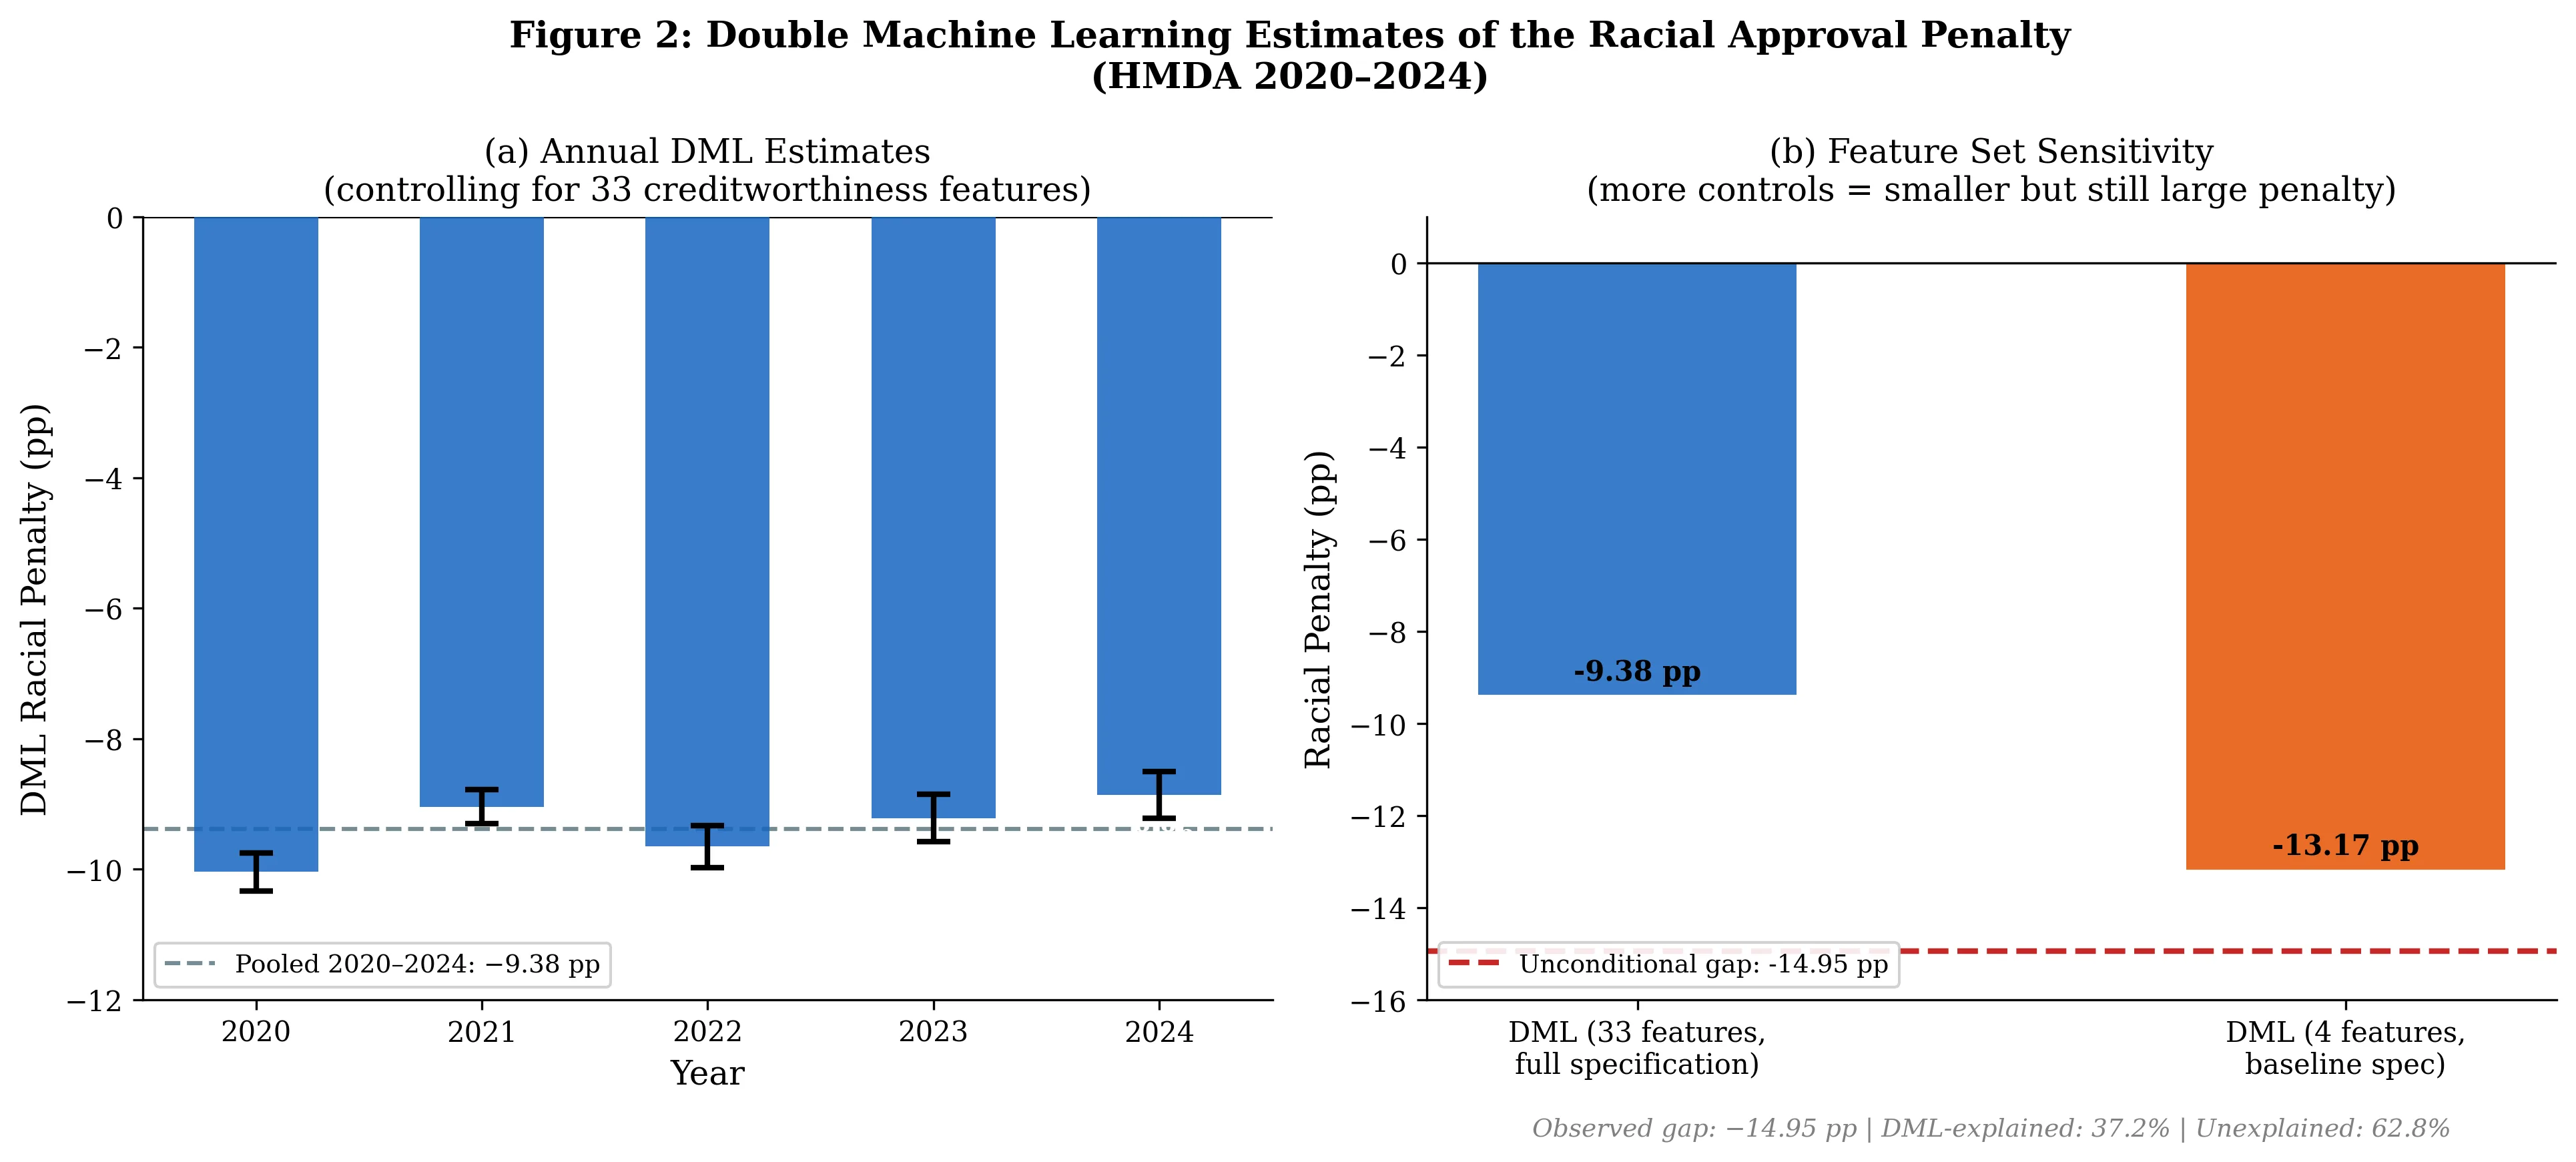
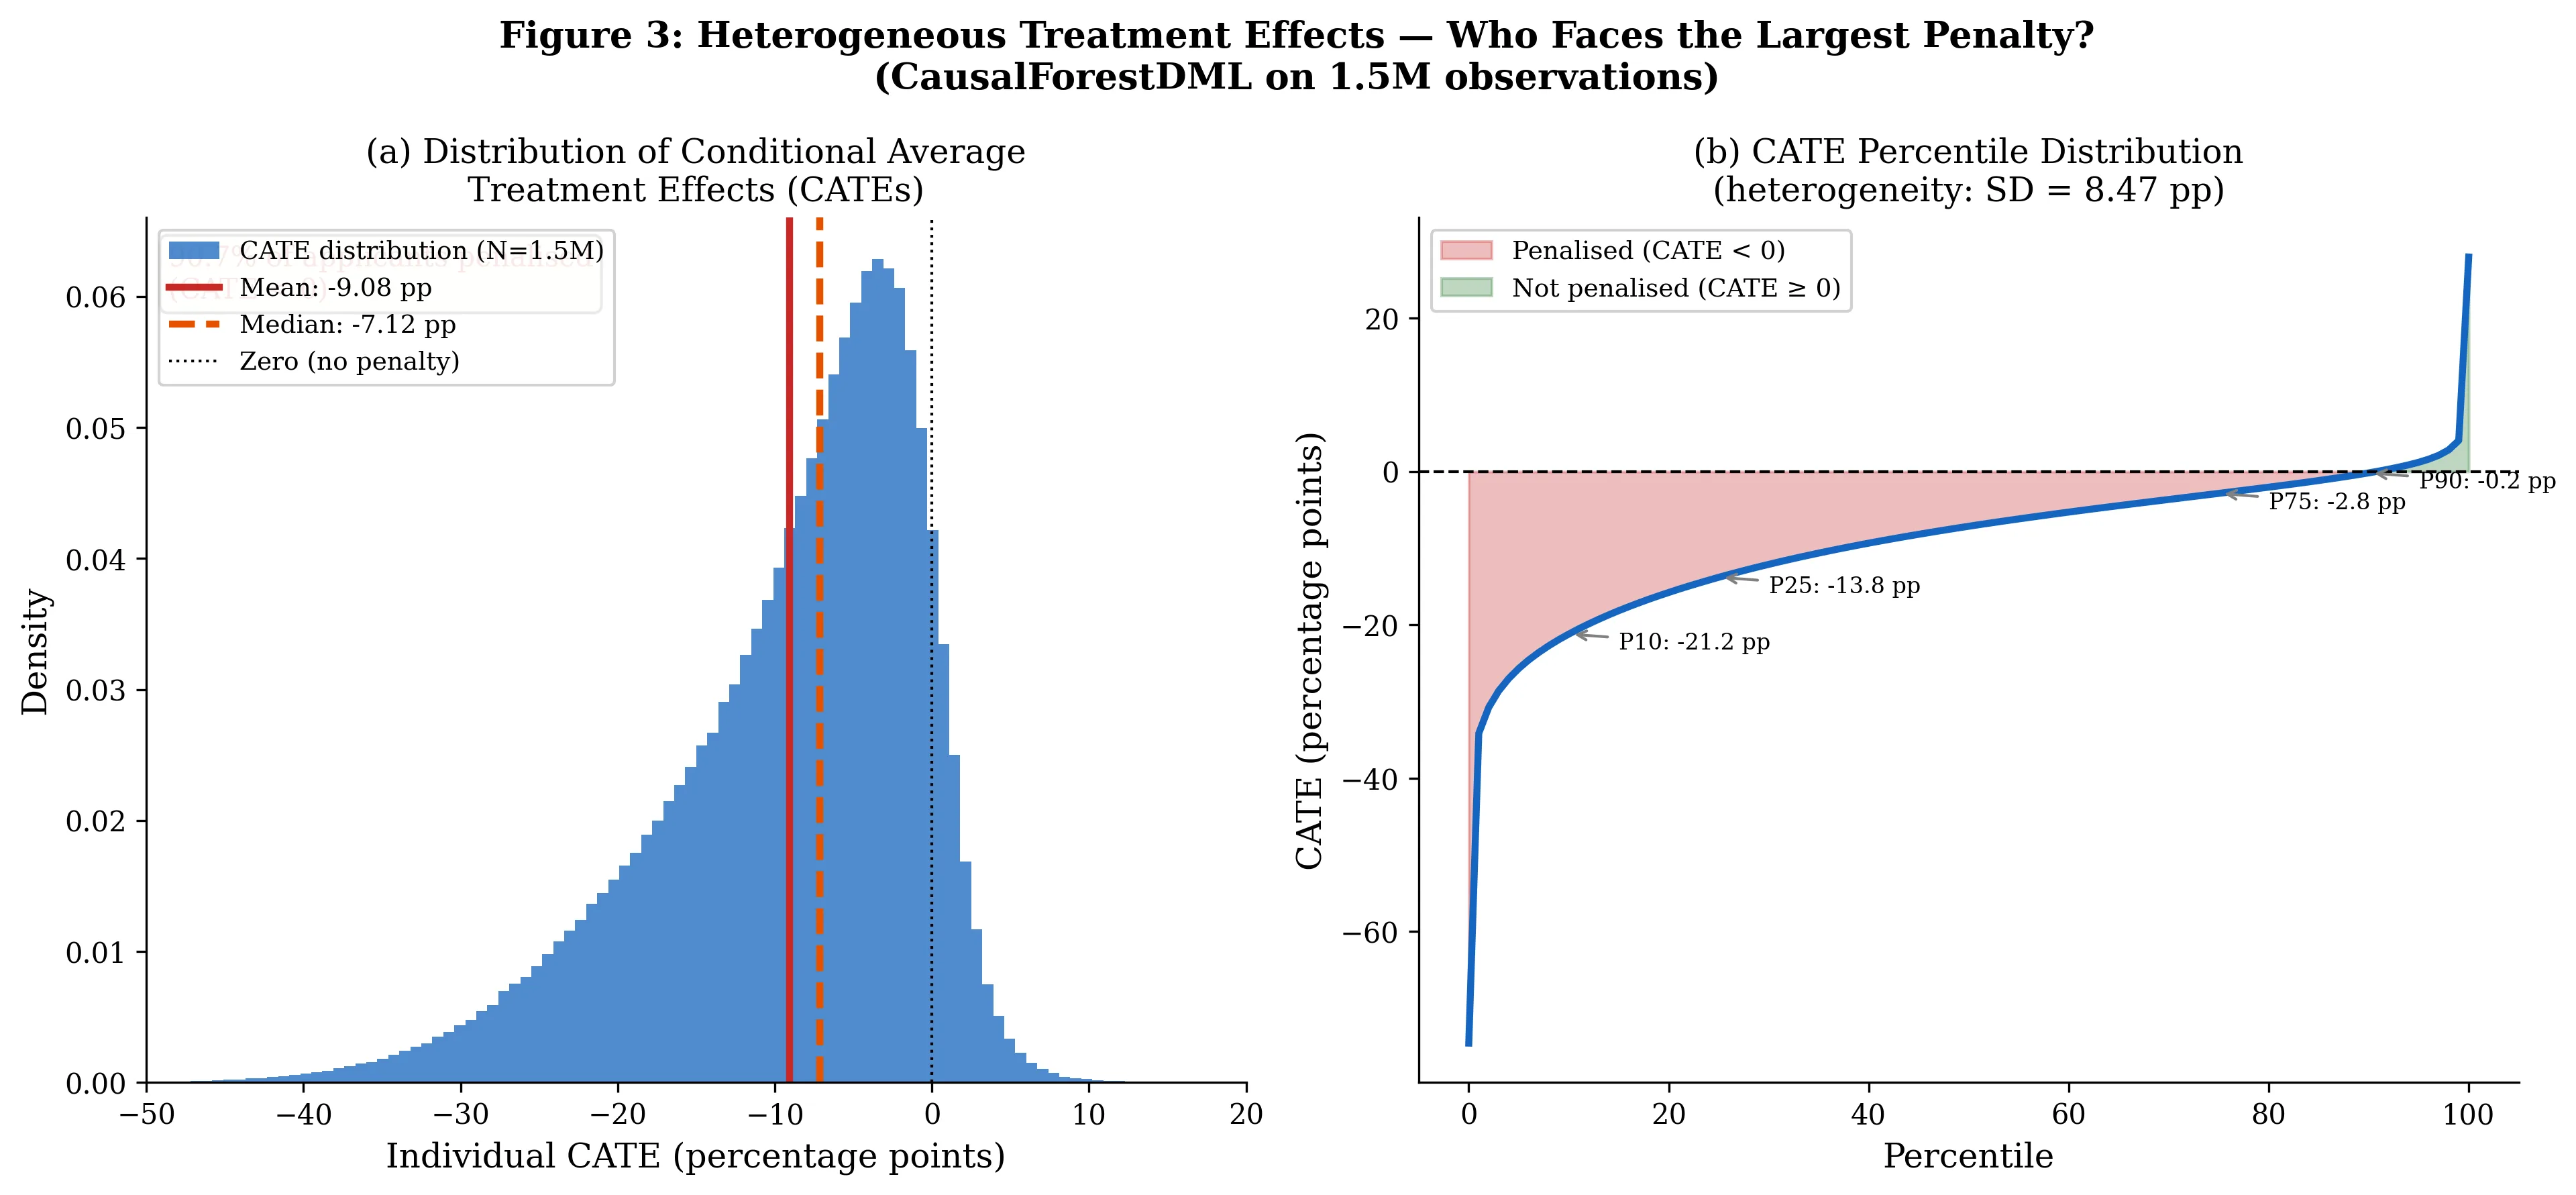
Figures as generated by the paper’s own analysis pipeline.
What this changes
It points the fairness question at an actionable mechanism, lender-controlled routing and handling, rather than at applicant characteristics.
Citation
Working paper. The public version is linked above. Reach me at rajveerpall04@gmail.com.