Comprehensive Evaluation of Machine Learning for Type 2 Diabetes Risk Prediction: Large-Scale External Validation and Fairness Analysis
Internally validated diabetes models lose discrimination and fairness when externally validated on 1.28M records — age subgroups suffer most.
The discovery in one figure
The paper in five minutes
A disease-risk model that shines on its home dataset can still mislead in the real world. We trained a standard diabetes risk model the careful way — strict cross-validation, tuned hyperparameters — and then did what most papers skip: tested it on 1.28 million people from a completely different national survey. Overall accuracy dropped about ten percent. Worse, the drop was not shared equally: for people over 60 the model degrades far more than for the young — a fairness failure that the single headline number completely hides.
The research question
Clinical risk models are usually reported with internal validation only. Do the numbers survive a different population, survey instrument, and label definition?
How it works
XGBoost and baselines developed on NHANES (n = 15,685) under strict nested cross-validation, then externally validated on BRFSS (n = 1,285,783) with DeLong CIs, calibration analysis, SHAP interpretability, and subgroup fairness audit. TRIPOD-AI reporting.
- 01Develop carefullyNHANES cohort (15,685) · nested cross-validation · Bayesian tuning
- 02ExplainSHAP attribution over eight non-laboratory predictors
- 03Externally validateBRFSS, 1,285,783 records — different survey, different population
- 04Audit subgroupsage, sex, BMI — with DeLong confidence intervals
- 05Report to standardTRIPOD-AI checklist
Experimental results
External AUC drops from 0.794 to 0.717 (−9.7%). The elderly subgroup degrades far more than the young (AUC 0.607 vs 0.742, gap 0.135) — aggregate accuracy hides an age-fairness failure.
0.7940.7170.7420.607External validation costs ~10% overall; adults over 60 lose far more (gap 0.135, p < 0.001).
- 0.794 → 0.717internal → external AUC (−9.7%)
- 0.135age-group AUC gap (18–39 vs ≥60)
- 1,285,783external validation records
Stated honestlyPublished in IEEE Xplore, DOI 10.1109/CIPHER70417.2026.11523789.
Figures from the paper
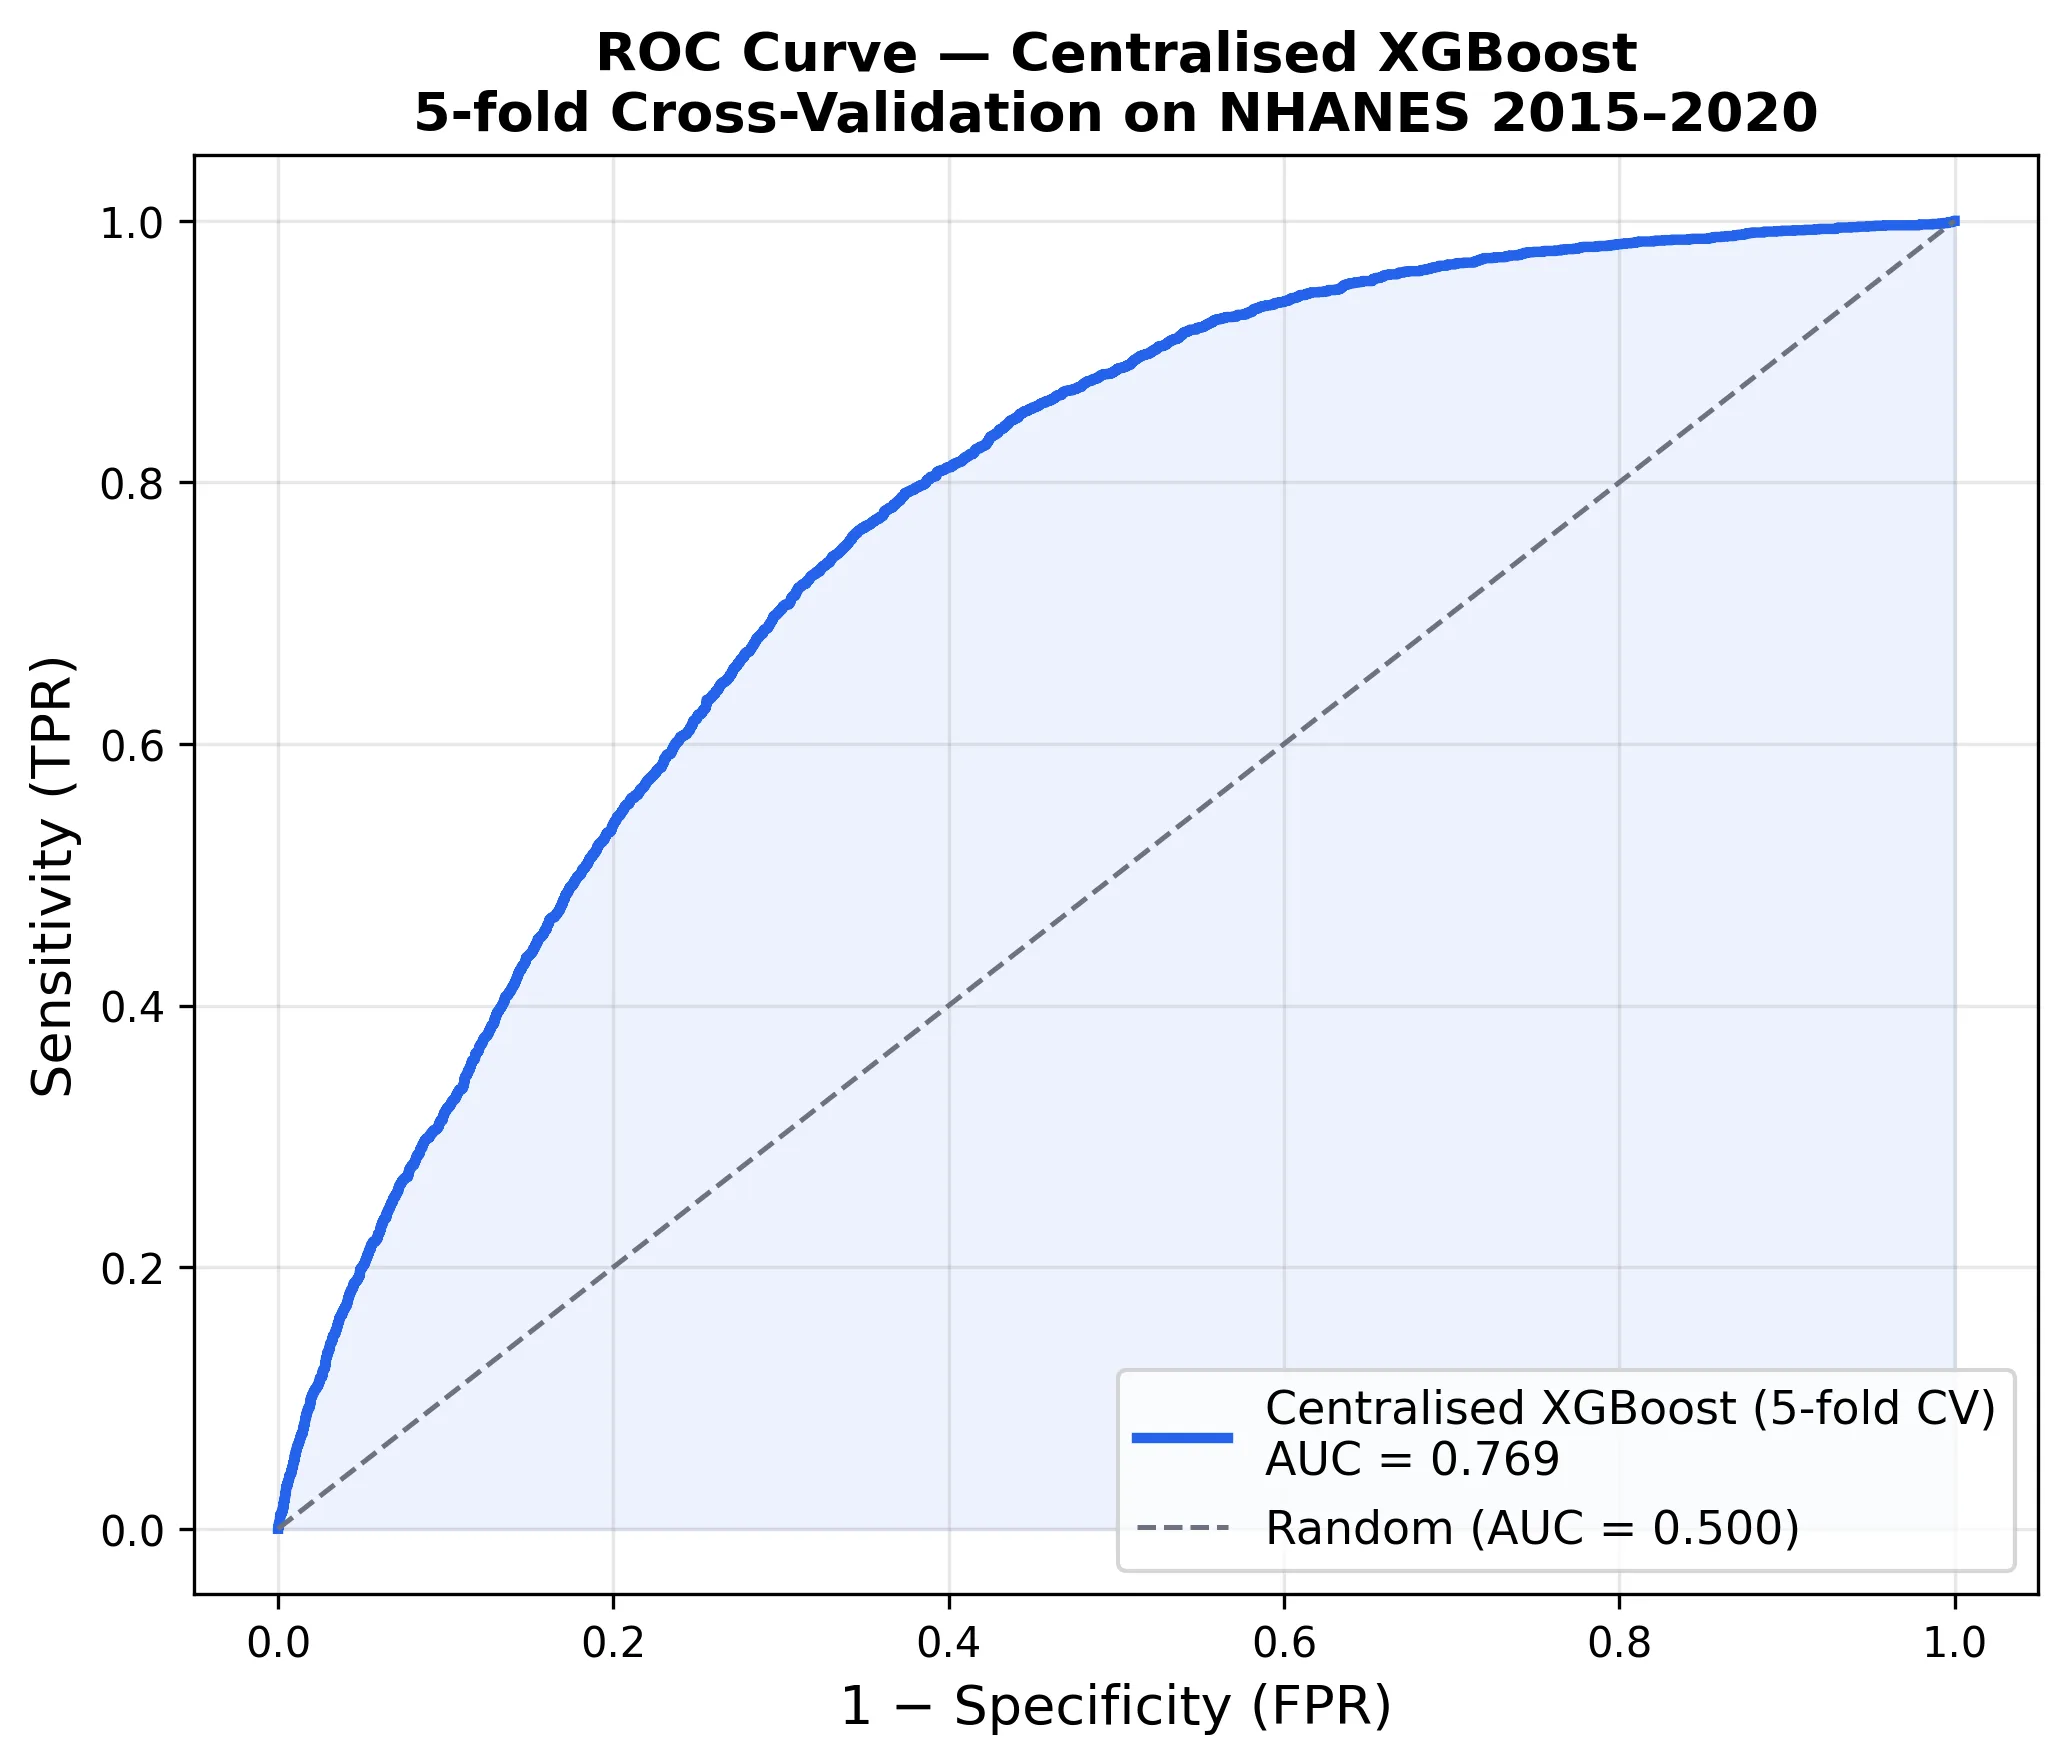
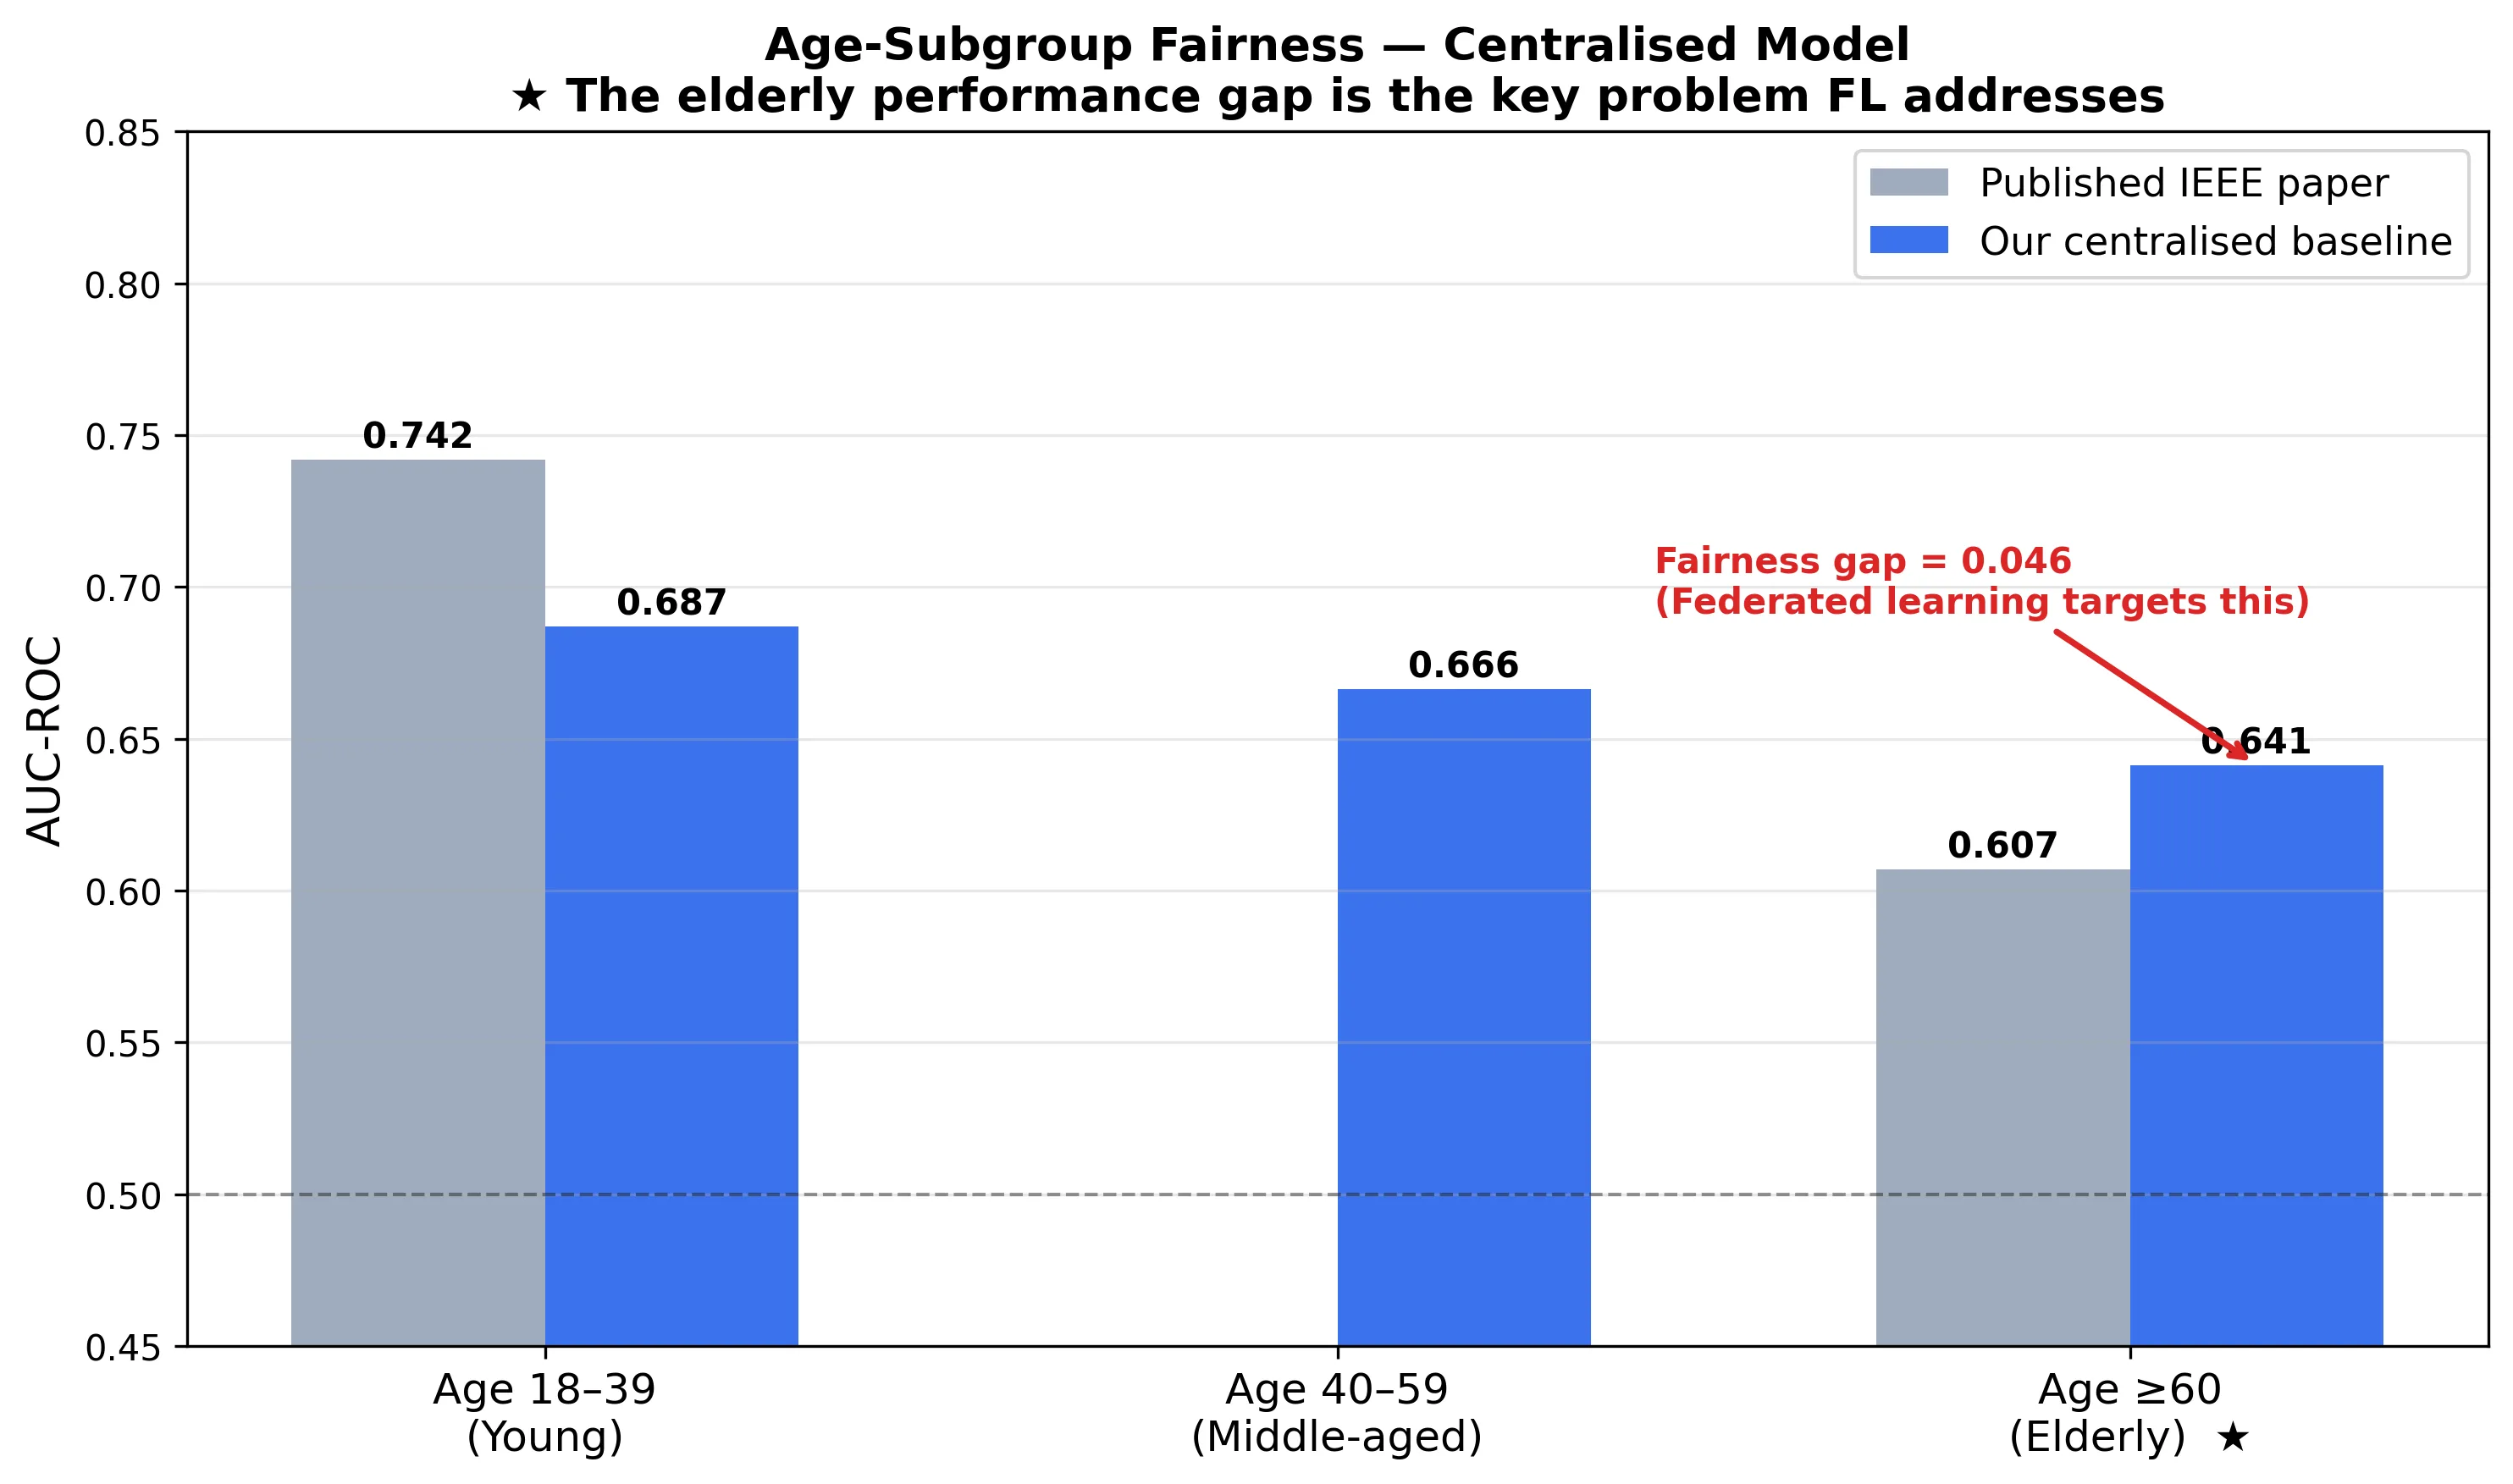
Figures generated by the paper's own pipeline — reproducible from the repository.
What this changes
The foundation result of the research program: benchmark performance is not deployment performance, and the failure is structured, not random.
Citation
Presented work — formal citation available on request. Reach me at rajveerpall04@gmail.com.