Higher AUC, Fewer Cases Flagged: Subgroup Fairness Metrics Can Reverse at the Decision Threshold in Federated Diabetes Screening
Federated training narrows the White-Black AUC gap while a race-blind screening policy flags fewer Black respondents.
The discovery in one figure
Swipe to see the whole figure
The paper in five minutes
Fairness in clinical prediction is usually checked by comparing AUC across groups. A screening programme, though, ranks patients and flags as many as it has capacity for. On more than a million external records, federated training makes the subgroup AUC audit look better while the screening decision it is supposed to justify gets worse for Black respondents. The paper shows exactly why the two readings disagree.
The research question
Does a subgroup AUC audit tell you what happens when a model is used at a fixed screening capacity?
How it works
Five federated strategies for diabetes risk prediction are compared with a composition-matched centralised control over ten seeds, with external validation on BRFSS (n = 1,282,897; 819,294 with race recorded). An exact decomposition of pooled AUC separates within-group ranking terms from the cross-group terms a shared threshold acts on.
- 01Train five federated strategiesagainst a composition-matched centralised control, ten seeds
- 02Validate externallyBRFSS, 1,282,897 respondents, 819,294 with race recorded
- 03Audit two wayswithin-group AUC, and who is flagged at a fixed screening capacity
- 04Decompose pooled AUCwithin-group terms versus the cross-group terms a threshold acts on
Experimental results
FedAvg narrows the White-Black AUC gap from 0.0075 to 0.0005, yet under a race-blind top-q screening policy the White-Black sensitivity gap widens from 0.009 to 0.034, which is 542 fewer reference-positive Black respondents flagged per 100,000. The reversal holds at every capacity from 1% to 50%, for all five strategies.
0.00750.00050.0090.034The AUC gap shrinks while the sensitivity gap at fixed capacity widens: the same model, judged two ways.
- 0.0075 → 0.0005White-Black AUC gap narrows
- 0.009 → 0.034White-Black sensitivity gap widens at fixed capacity
- 542fewer Black respondents flagged per 100,000
Stated honestlyThe AUC gains are small in magnitude. An earlier version of this pipeline had implementation defects; the repository documents them and the findings they retired.
Figures from the paper
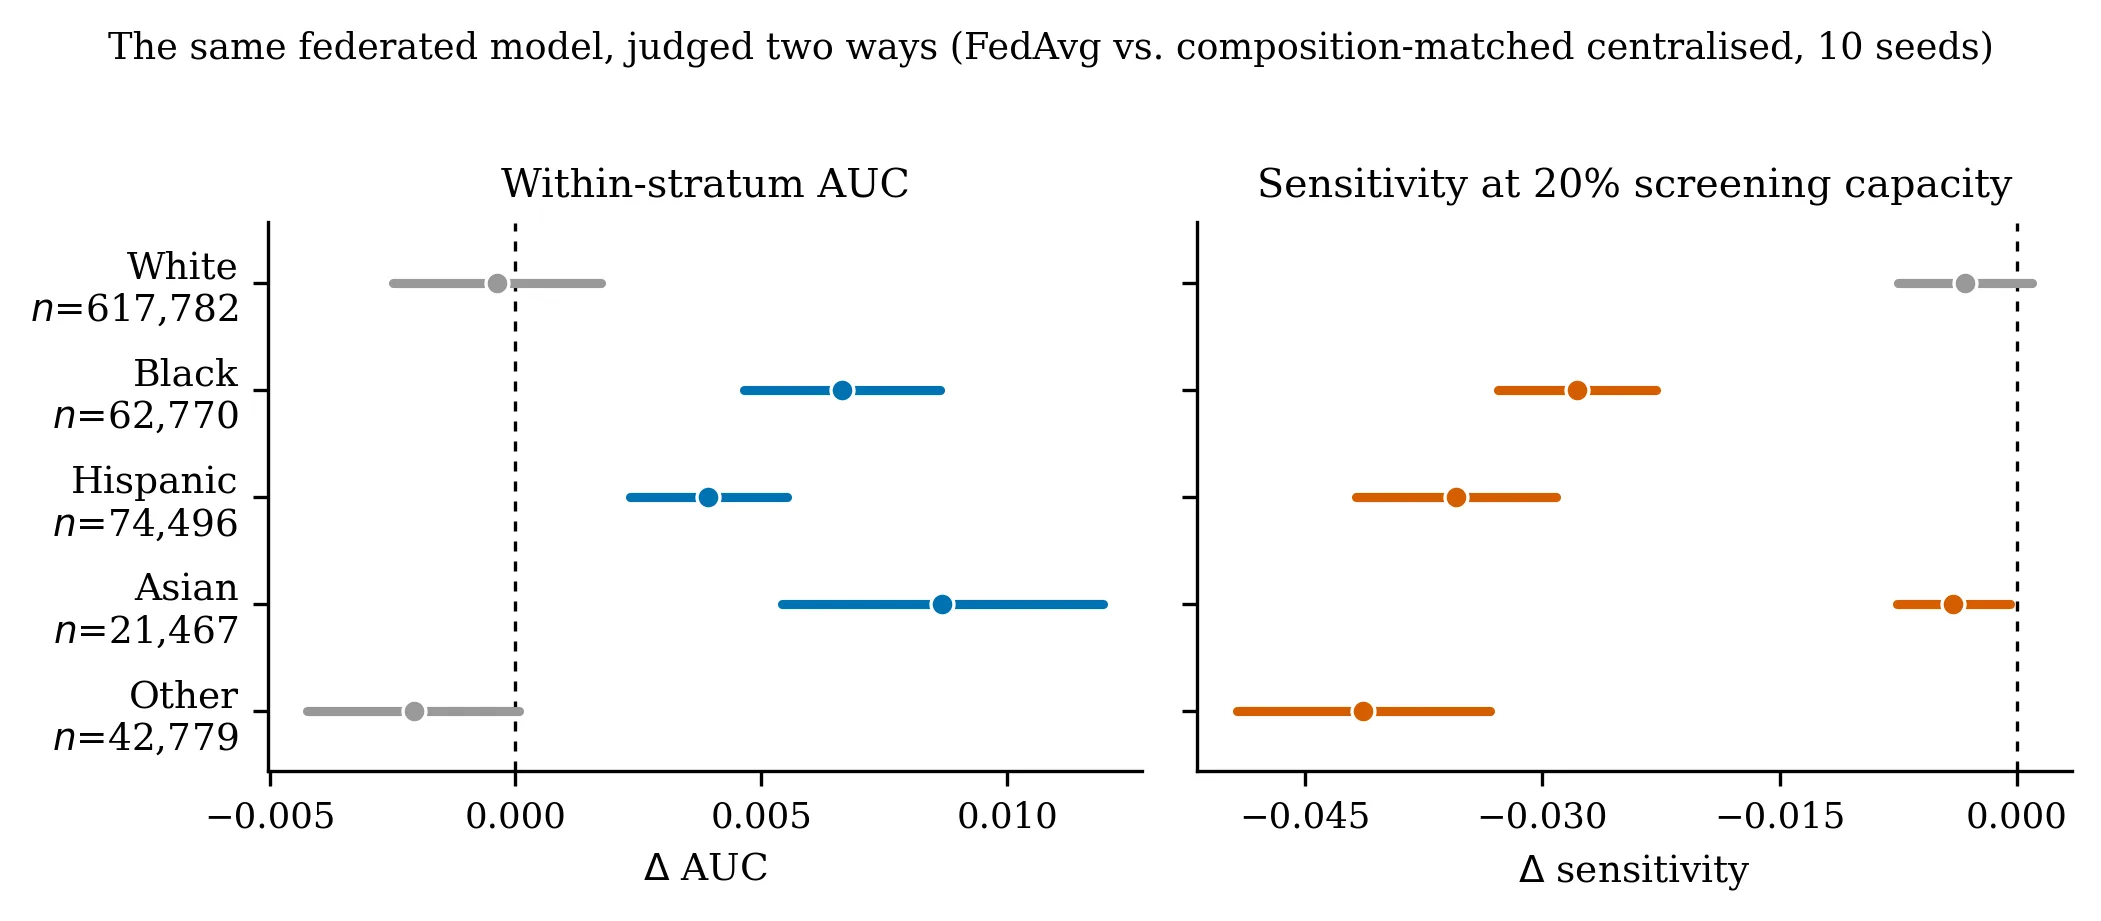
Figures as generated by the paper’s own analysis pipeline.
What this changes
A subgroup audit reads the within-group terms while a shared threshold depends on the cross-group terms, and here the two move in opposite directions. Subgroup AUC alone can report an equity improvement while missing the allocation effect on the group it is meant to protect.
Citation
Manuscript under review. The citation will be posted on acceptance. Reach me at rajveerpall04@gmail.com.